梯度下降是求解函数最小值的算法,也称为最速下降法,它通过梯度更新不断的逼近最优解
常用的比喻是下山问题,通过计算梯度能够找到函数值变化最快的地方,通过步长决定收敛的速度
梯度下降方法包括批量梯度下降、随机梯度下降和小批量梯度下降,下面通过梯度下降计算多变量线性回归问题
多变量线性回归
参考线性回归
\[ Y=X\cdot W \]
其中
\[ Y_{m\times 1}=\begin{bmatrix} y_{1}\\ y_{2}\\ ...\\ y_{m} \end{bmatrix} \]
\[ X_{m\times (n+1)}=\begin{bmatrix} x_{10} & x_{11} & ... & x_{1n}\\ x_{20} & x_{21} & ... & x_{2n}\\ ... & ... & ... & ...\\ x_{m0} & x_{m1} & ... & x_{mn} \end{bmatrix} =\begin{bmatrix} 1 & x_{11} & ... & x_{1n}\\ 1 & x_{21} & ... & x_{2n}\\ ... & ... & ... & ...\\ 1 & x_{m1} & ... & x_{mn} \end{bmatrix} \]
\[ W_{(n+1)\times 1}= \begin{bmatrix} w_{0} \\ w_{1} \\ ... \\ w_{n} \end{bmatrix} \]
多变量测试数据
使用UCI提供的计算机硬件数据集machine-data,其包含10类数据
- vendor name: 厂商名
- Model Name: 型号名
- MYCT: 机器周期(/ns)
- MMIN: 主存最小值(/KB)
- MMAX: 主存最大值(/KB)
- CACH: 缓存大小(/KB)
- CHMIN: 通道最小值
- CHMAX: 通道最大值
- PRP: 相对性能
- ERP: cpu相对性能
使用第3-8项作为训练数据,使用第9项作为真实数据进行训练
批量梯度下降
批量梯度下降(batch gradient descent)每次迭代将所有样本数据都加入计算,其损失函数MSE如下:
\[ J(\theta) = \frac{1}{N}\cdot \sum_{j=1}^{N}(h(x_{j};\theta)-y_{j})^{2} \]
\[ \Rightarrow J(\theta) = \frac{1}{N} (X\cdot W-Y)^T\cdot(X\cdot W -Y) \]
批量求导如下
\[ \frac{\varphi }{\varphi w_{i}}J(\theta) = \frac{1}{N} \sum_{j=1}^{N}(h(x_{j};\theta)-y_{j})\cdot x_{j,i}) \]
\[ \Rightarrow \frac{\varphi }{\varphi w_{i}}J(\theta) = \frac{1}{N} X[i]^T\cdot (X\cdot W - Y) \]
\[ \Rightarrow \frac{\varphi }{\varphi w}J(\theta) = \frac{1}{N} X^T\cdot (X\cdot W - Y) \]
其中\(x_{j,i}\)表示第\(j\)行第\(i\)列,\(X[i]\)表示第\(i\)列
随机梯度下降
随机梯度下降(stochastic gradient descent)每次更新仅使用一条数据,其损失函数MSE如下:
\[ J(\theta,j) = (h(x_{j};\theta)-y_{j})^{2} \]
批量求导如下
\[ \frac{\varphi }{\varphi w_{i}}J(\theta) = \frac{1}{2} (h(x_{j};\theta)-y_{j})\cdot x_{j,i} \]
\[ \Rightarrow \frac{\varphi }{\varphi w}J(\theta) = \frac{1}{2}(h(x_{j};\theta)-y_{j})\cdot X[j]^T \]
其中\(x_{j,i}\)表示第\(j\)行第\(i\)列,\(X[j]\)表示第\(j\)行
在训练之前应该打乱训练集数据,以避免数据顺序对算法结果造成影响
小批量随机梯度下降
小批量梯度下降(small batch gradient descent)介于批量和随机梯度下降之间,每次更新使用给定数量的训练数据来更新参数,其损失函数MSE如下:
\[ J(\theta,i:j) = \frac{1}{j-i} \sum_{k=1}^{j-i}(h(x_{k};\theta)-y_{k})^{2} \]
小批量求导如下
\[ \frac{\varphi }{\varphi w_{l}}J(\theta) = \frac{1}{j-i}\sum_{k=1}^{j-i} (h(x_{k};\theta)-y_{k})\cdot x_{k,l} \]
\[ \Rightarrow \frac{\varphi }{\varphi w}J(\theta) = \frac{1}{j-i}X[i:j]^T\cdot (X[i:j]\cdot W-Y[i:j]) \]
示例
使用numpy实现了批量梯度下降和随机梯度下降方法
1
2
3
4
5
6
7
8
9
10
11
12
13
14
15
16
17
18
19
20
21
22
23
24
25
26
27
28
29
30
31
32
33
34
35
36
37
38
39
40
41
42
43
44
45
46
47
48
49
50
51
52
53
54
55
56
57
58
59
60
61
62
63
64
65
66
67
68
69
70
71
72
73
74
75
76
77
78
79
80
81
82
83
84
85
86
87
88
89
90
91
92
93
94
95
96
97
98
99
100
101
102
103
104
105
106
107
108
109
110
111
112
113
114
115
116
117
118
119
120
121
122
123
124
125
126
127
128
129
130
131
132
133
134
135
136
137
138
139
140
141
142
143
144
145
146
147
148
149
150
151
152
153
154
|
"""
梯度下降法计算线性回归问题
"""
import matplotlib.pyplot as plt
import numpy as np
def load_ex1_multi_data():
"""
加载多变量数据
"""
path = '../data/coursera2.txt'
datas = []
with open(path, 'r') as f:
lines = f.readlines()
for line in lines:
datas.append(line.strip().split(','))
data_arr = np.array(datas)
data_arr = data_arr.astype(np.float)
X = data_arr[:, :2]
Y = data_arr[:, 2]
return X, Y
def load_machine_data():
"""
加载计算机硬件数据
"""
data = np.loadtxt('../data/machine.data', delimiter=',', dtype=np.str)
x = data[:, 2:8].astype(np.float)
y = data[:, 8].astype(np.float)
return x, y
def draw_loss(loss_list):
"""
绘制损失函数值
"""
fig = plt.figure()
plt.plot(loss_list)
plt.show()
def init_weight(size):
"""
初始化权重,使用均值为0,方差为1的标准正态分布
"""
return np.random.normal(loc=0.0, scale=1.0, size=size)
def compute_loss(w, x, y):
"""
计算损失值
"""
n = y.shape[0]
return (x.dot(w) - y).T.dot(x.dot(w) - y) / n
def using_batch_gradient_descent():
"""
批量梯度下降
"""
x, y = load_machine_data()
extend_x = np.insert(x, 0, values=np.ones(x.shape[0]), axis=1)
w = init_weight(extend_x.shape[1])
n = y.shape[0]
epoches = 50
alpha = 1e-9
loss_list = []
for i in range(epoches):
temp = w - alpha * extend_x.T.dot(extend_x.dot(w) - y) / n
w = temp
loss_list.append(compute_loss(w, extend_x, y))
draw_loss(loss_list)
def using_stochastic_gradient_descent():
"""
随机梯度下降
"""
x, y = load_machine_data()
extend_x = np.insert(x, 0, values=np.ones(x.shape[0]), axis=1)
w = init_weight(extend_x.shape[1])
print(w.shape)
np.random.shuffle(extend_x)
print(extend_x.shape)
print(y.shape)
n = y.shape[0]
epoches = 20
alpha = 1e-9
loss_list = []
for i in range(epoches):
for j in range(n):
temp = w - alpha * (extend_x[j].dot(w) - y[j]) * extend_x[j].T / 2
w = temp
loss_list.append(compute_loss(w, extend_x, y))
draw_loss(loss_list)
def using_small_batch_gradient_descent():
"""
小批量梯度下降
"""
x, y = load_machine_data()
extend_x = np.insert(x, 0, values=np.ones(x.shape[0]), axis=1)
w = init_weight(extend_x.shape[1])
print(w.shape)
np.random.shuffle(extend_x)
print(extend_x.shape)
print(y.shape)
batch_size = 16
n = y.shape[0]
epoches = 20
alpha = 5e-9
loss_list = []
for i in range(epoches):
for j in list(range(0, n, batch_size)):
temp = w - alpha * extend_x[j:j + batch_size].T.dot(
extend_x[j:j + batch_size].dot(w) - y[j:j + batch_size]) / batch_size
w = temp
loss_list.append(compute_loss(w, extend_x, y))
draw_loss(loss_list)
if __name__ == '__main__':
using_stochastic_gradient_descent()
|
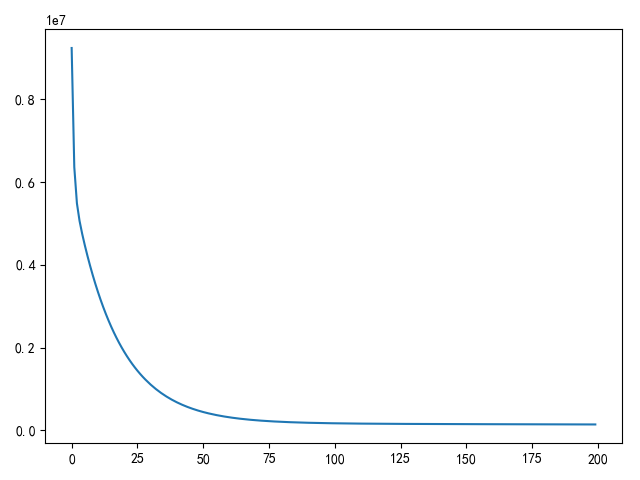
批量梯度下降损失图

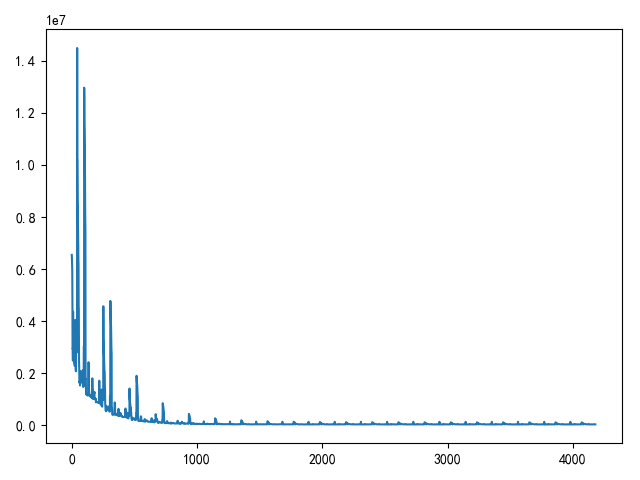
随机梯度下降损失图

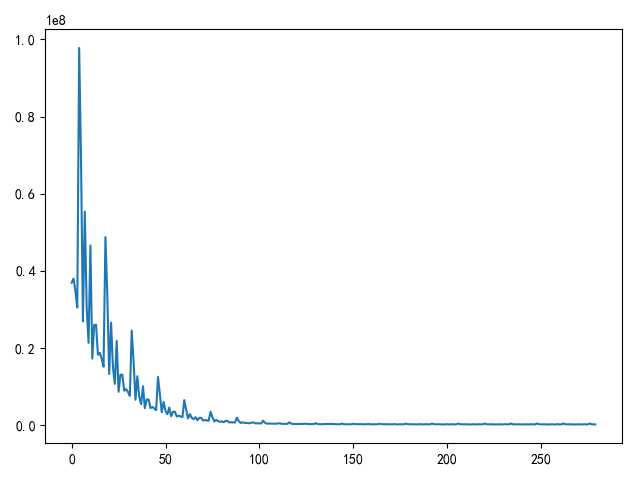
小批量随机梯度下降损失图

3种梯度下降比较
- 批量梯度下降
- 优点:每次更新需要计算所有样本,从而得到的梯度更具有代表性,所以损失值收敛速度最快
- 缺点:由于每次梯度更新都需要计算所有样本,对于大样本数据训练需要更多的训练时间和训练资源
- 随机梯度下降
- 优点:每次更新仅需单个样本数据参与,权重更新速度快
- 缺点:计算的梯度不一定符合整体最优路径,需要更多的迭代才能完成收敛
- 小批量梯度下降:结合批量梯度下降和随机梯度下降的优点,小批量样本计算得到的梯度更接近全局样本,同时提高梯度计算和权重更新速度
相关阅读


